I have to chuckle any time stats are thrown around when discussing road safety issues like speeding or impaired driving. It reminds me of that old saying: “There are three kinds of lies: lies, damned lies and statistics.”
It’s not that figures compiled by police departments or municipal enforcement agencies are incorrect, they simply don’t tend to tell the whole story of the issue at hand.
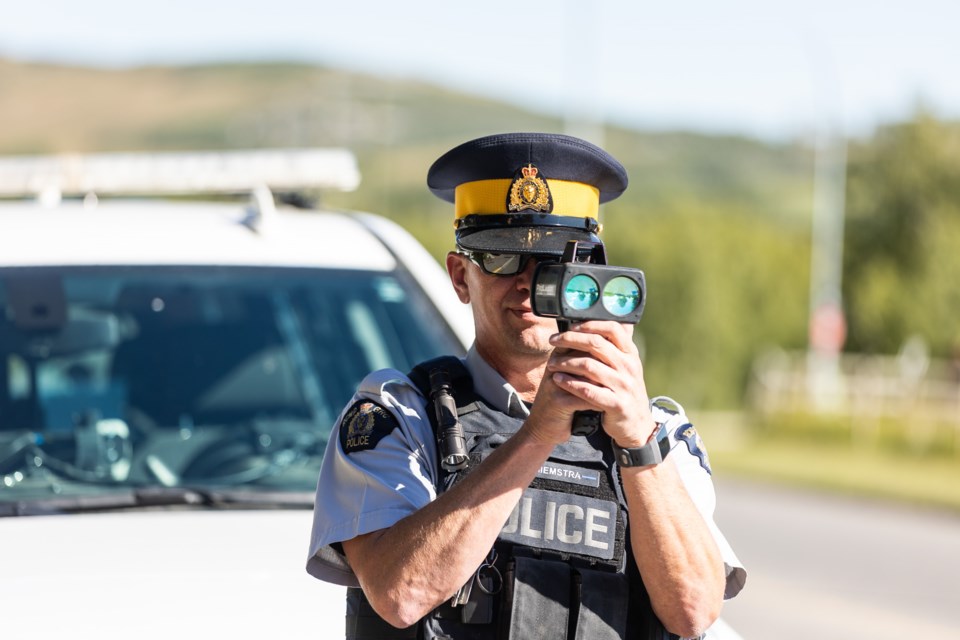
Okotoks council was recently told that speeding tickets and warnings issued by peace officers increased by 34 per cent as 1,151 drivers were nabbed in 2023 compared to 856 a year earlier.
Does this spike in tickets and warnings mean that more drivers are speeding in Okotoks? The 34 per cent increase would suggest so, but I’m dubious that’s the case. I think the higher number can more likely be attributed to an increase in enforcement than any great shift in driving habits.
I’ve found that statistics on certain crimes — break-ins, assaults, etc. — are pretty darn accurate, so percentage swings from year to year can be illuminating, however when it gets into those where enforcement plays an integral role, the figures can be a lot more malleable. I tend to take those numbers with a boulder of salt.
Is something like distracted driving down from one month to the next, or one year to another, because fewer people are on their phones or is it because fewer blitzes have been undertaken to catch offenders? The same goes for impaired driving, speeding, even failing to come to a complete stop at a stop sign.
There's no denying that regular enforcement can change driving habits for the better, but there’s also no doubt that policing agencies don’t have infinite resources, so they must pick and choose their priorities. Provincial campaigns, political pressure or squeaky local wheels can influence such decisions, ultimately pushing statistics one way or another.
The ensuing figures are accurate in the sense that they reflect the number of offences documented, but it’s difficult to believe they tell the whole story.
I remember a time years ago in a community far, far away when one of our reporters reached out to the police department to inquire about its strategy to deal with New Year’s Eve revelers, specifically those who might be getting behind the wheel after having had a few too many.
We expected the usual response about police setting up roadblocks at strategic, but unspecified, locations throughout town, but instead, in a moment of unvarnished truth, we were told there wouldn’t be any roadblocks this year because too many officers would be off duty that night thanks to use-them-or-lose-them sick days that were set to expire at midnight.
We were asked not to share such information with the public, and although it felt like we were complicit in a bit of a coverup, we deemed it better to go that route than to announce to all partiers out there that they could drive with impunity.
Suffice to say, the number of impaired drivers was down that New Year’s Eve. At least that’s what the stats told us.